inline-python
Use the right tool for the job. In my everyday life, this means writing simulations
in Rust and visualize the results in Python. Thanks to inline-python
this process works extremely well.
use inline_python::python;

fn main() {
    let x: Vec<f32> = (0..628).map(|i| i as f32 / 100.).collect();
    let y: Vec<f32> = x.iter().map(|x| x.sin()).collect();

    python! {
        import numpy as np
        from matplotlib import pyplot as plt

        plt.plot('x, 'y)
        plt.show()
    }
}
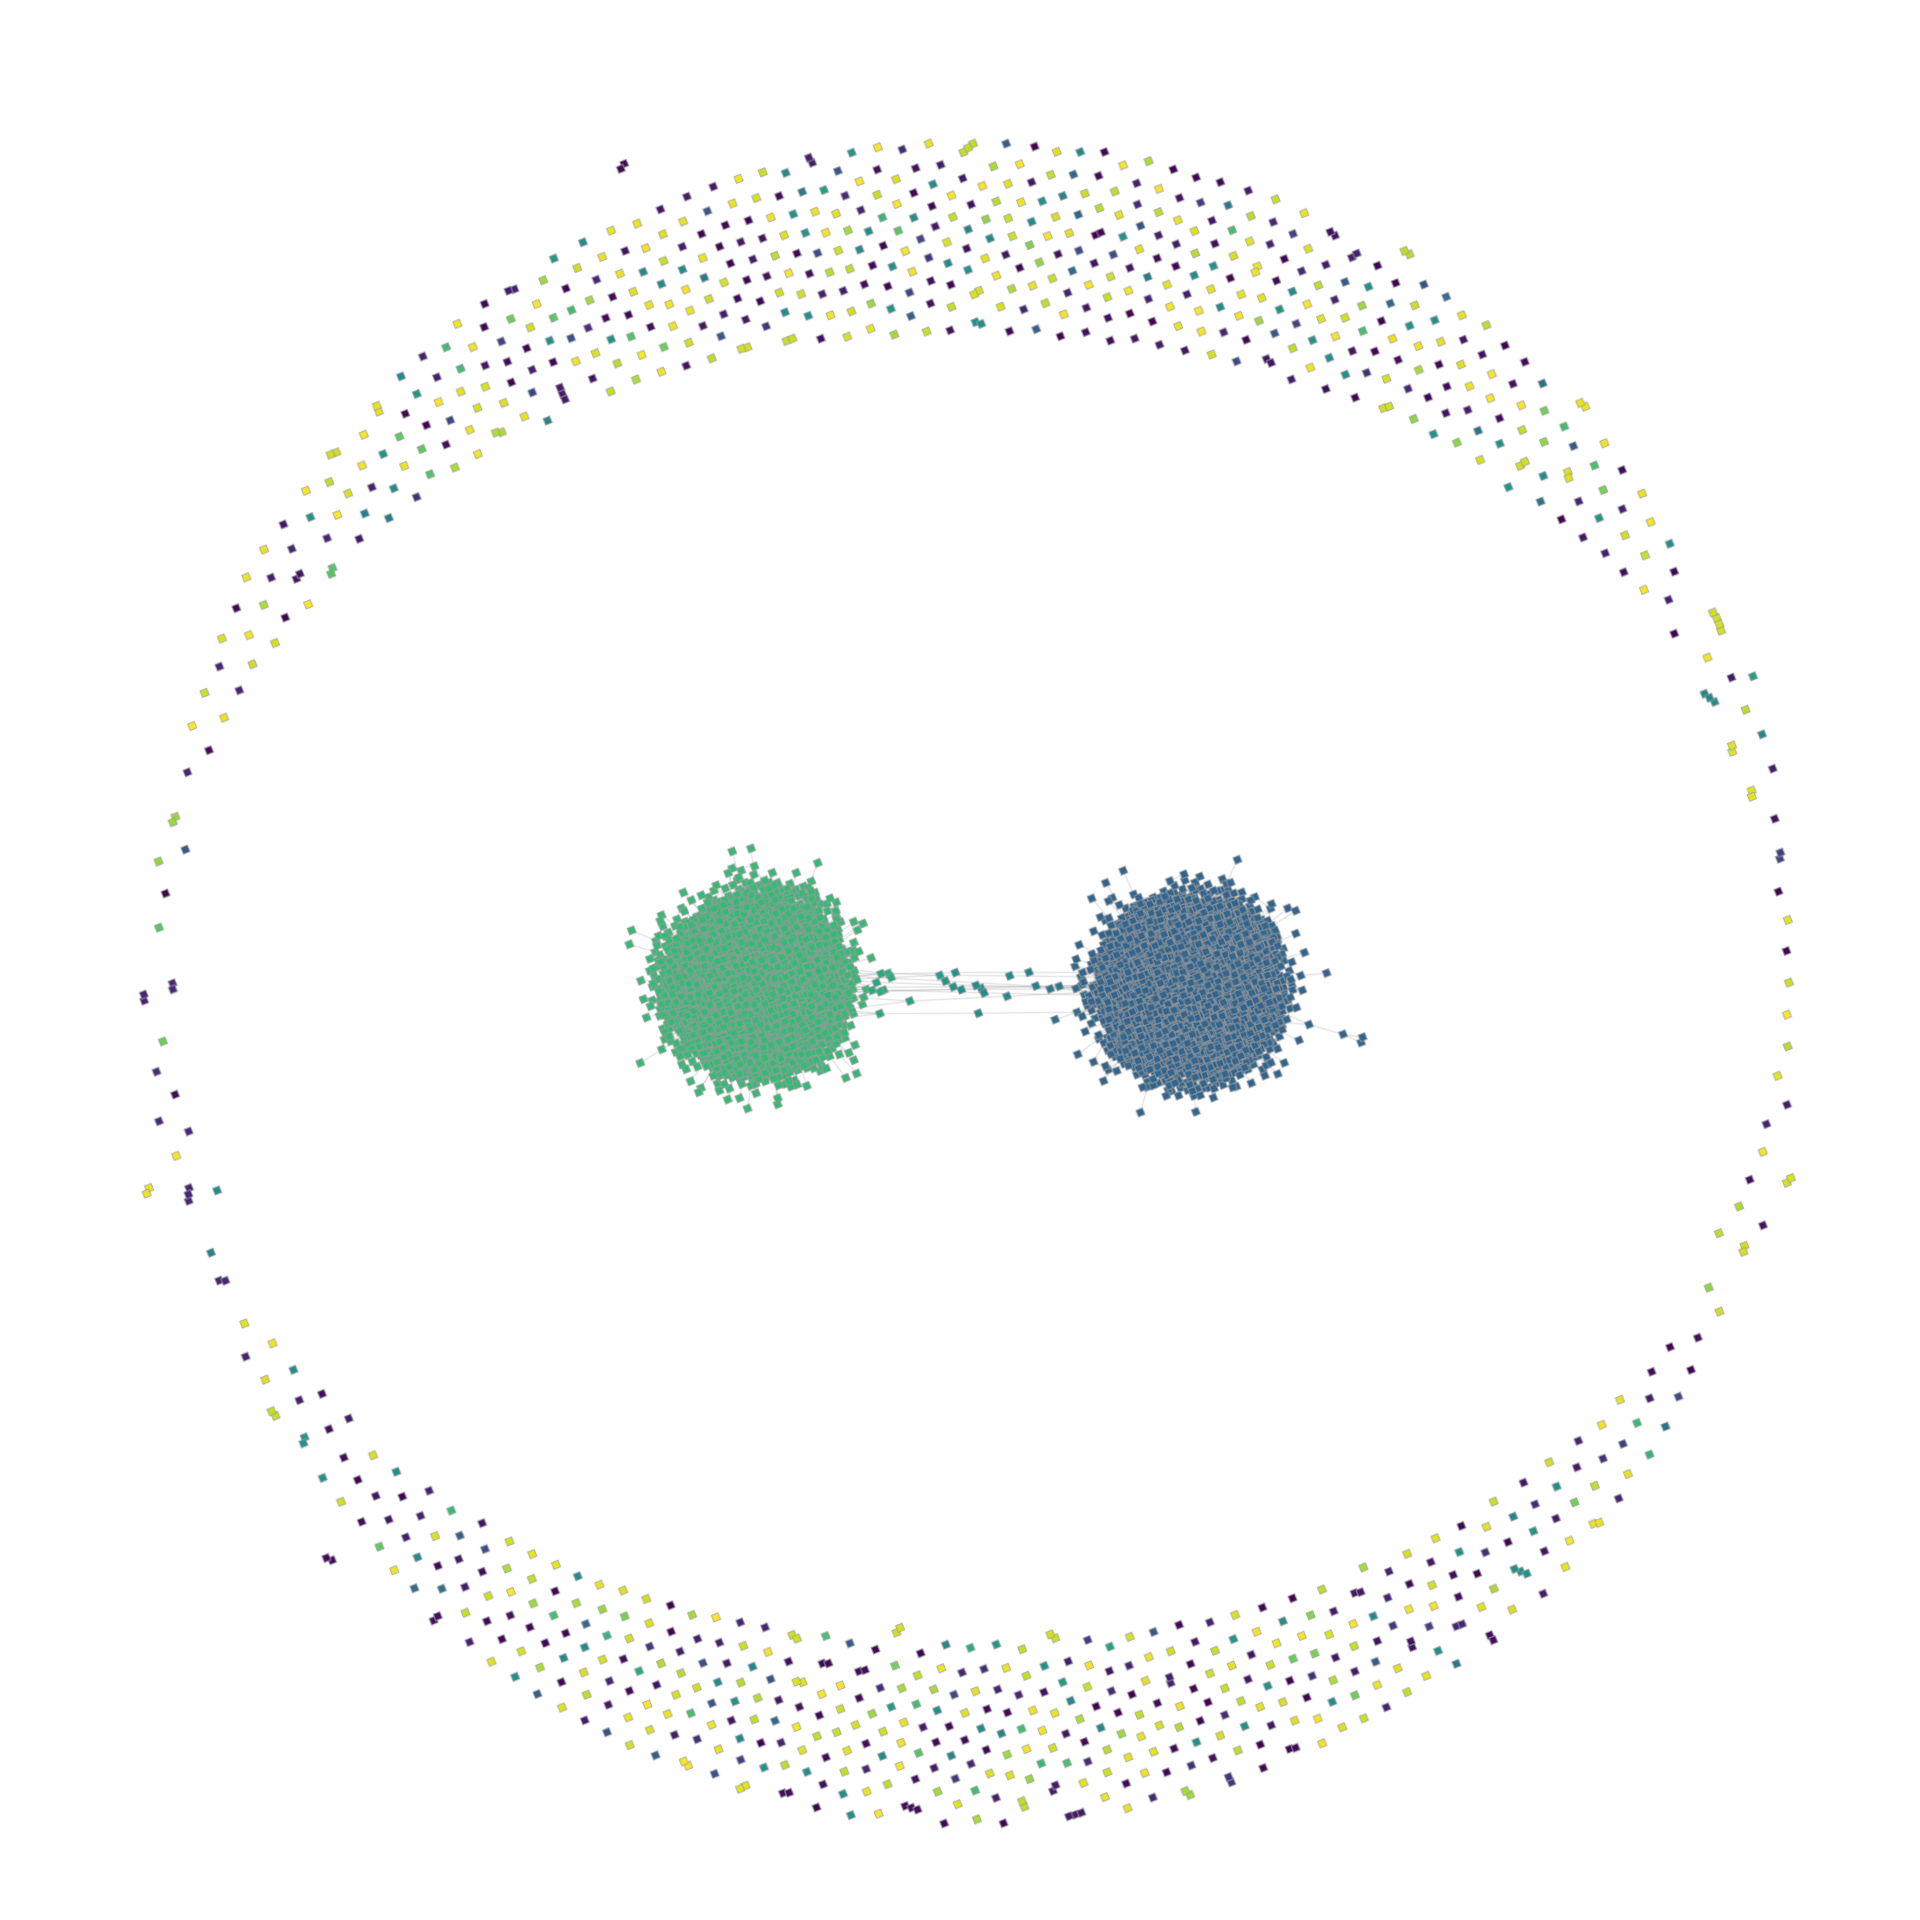
This minimal example is useless of course. But I already used this crate productively to simulate dynamics on a petgraph graph and visualize its state via graph-tool.